You can set a trace level for DDE applications and control whether to trace the DDE messages and/or the DDE DLL's (ESLDDE.DLL) actions. This trace output is written to the errorlog. The trace levels can be combined, by adding the various values, therefore trace level 15 includes all trace options. Tip: To ensure a DDE trace is available whenever it is needed, code a call to DDESetTraceLevel within the response to start, passing a global variable as the level. When the ESL is executed, merely set the trace level using the -d command line option, as per the following example:
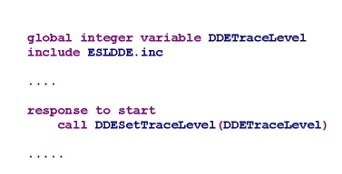
...\eslrun.exe MyESLApp -e ErrorLog.txt -d DDETraceLevel 15
Windows Trace Levels:
Level# |
Description |
1 |
Traces all Windows DDE messages that the DDE DLL receives. |
2 |
Traces the DDE DLL's default actions. |
4 |
Traces stimulus messages sent by the DDE DLL |
8 |
Traces all DLL entry points. |
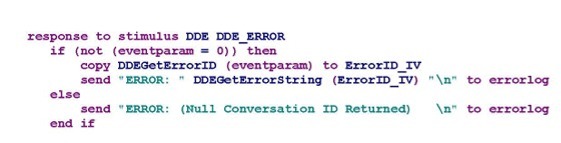
•Code responses to DDE_ERROR for both the client and server using subroutines DDEGetErrorID and DDEGetErrorString to obtain all relevant error information. The following is an example of an error handling response;
•Code error messages in responses to DDE stimuli and send them to the errorlog. Try to make error messages as descriptive as possible to help in debugging the DDE application.
•If both client and server are ESL applications, be sure to use different names.
•Use unique topic and application names for each set of DDE partners.
•Send acknowledgments frequently between applications.
•Run with -terp and -apio switches where appropriate.
•Use the "DDE Spy" tool, supplied with Microsoft's Visual Studio.